
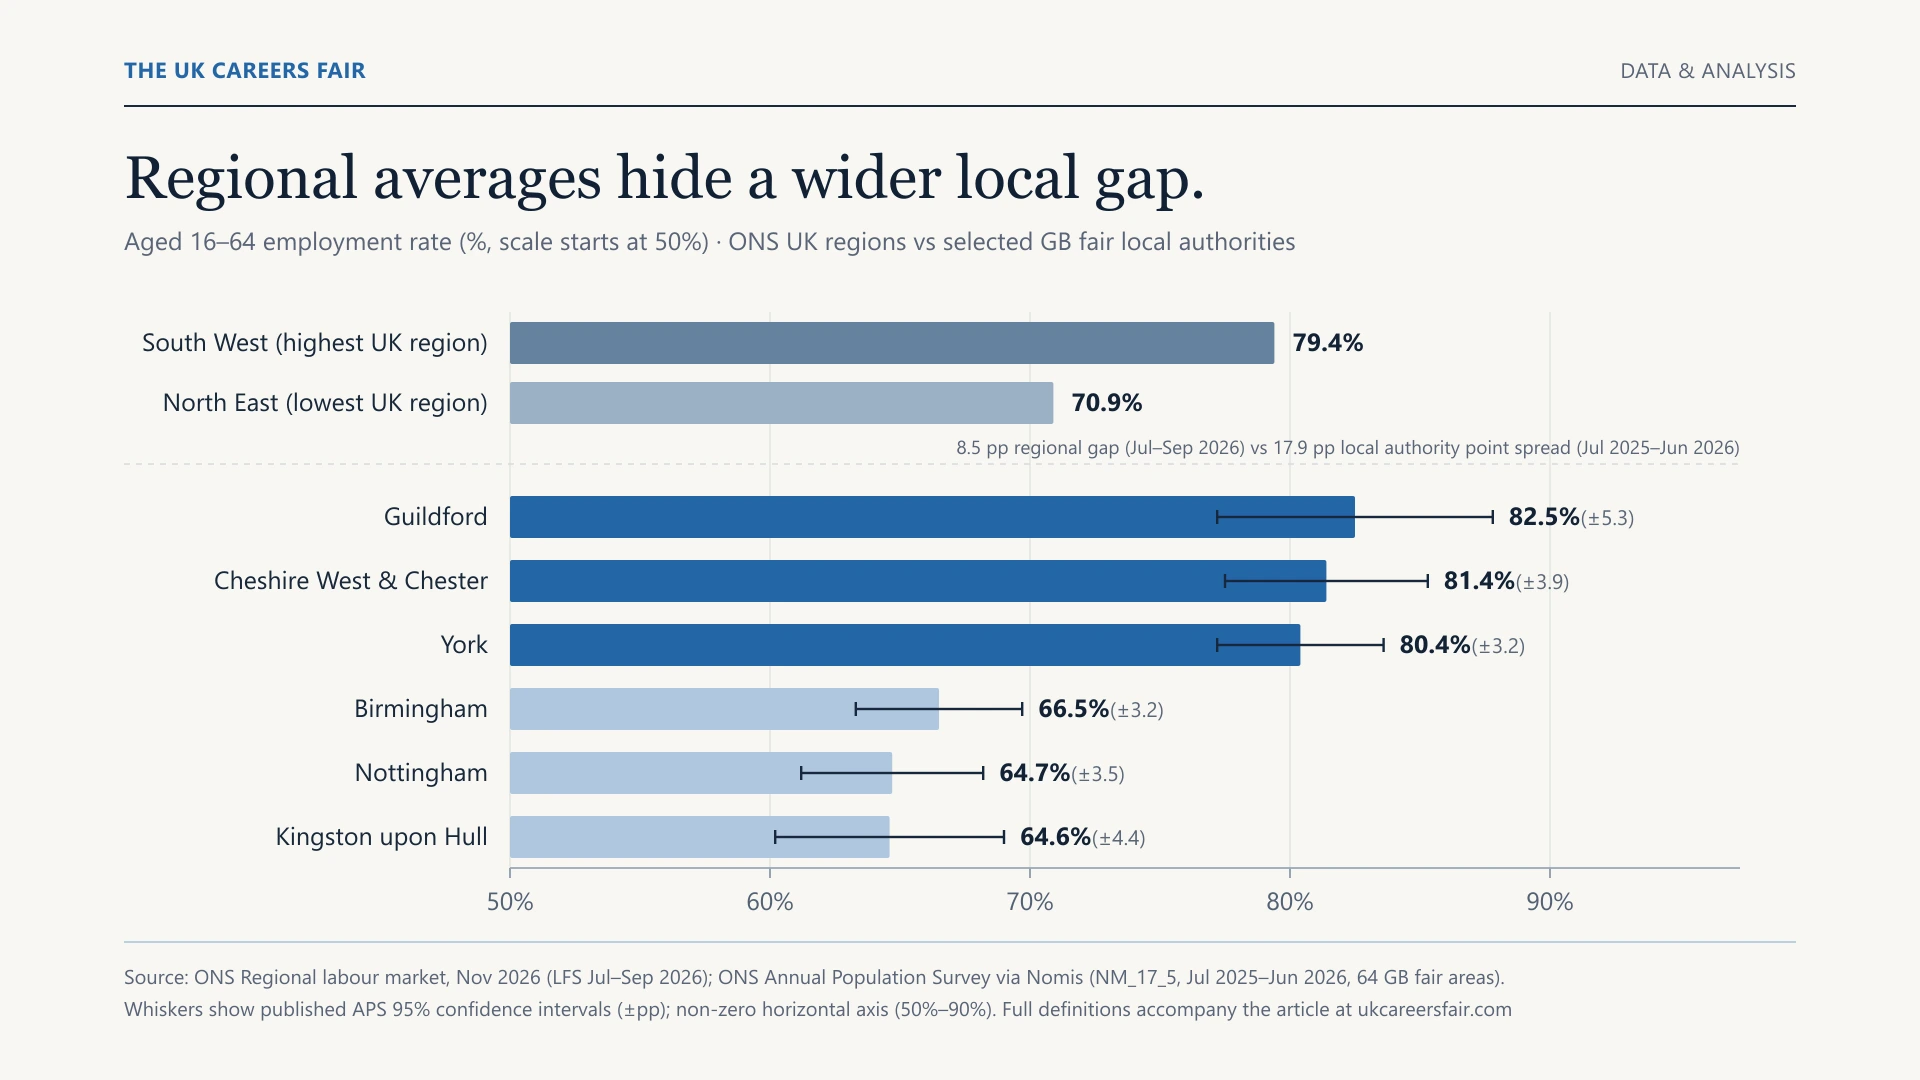
Estimated UK job vacancies fell by 22,000 (3.0%) on the quarter to 690,000 in August to October 2026, according to Office for National Statistics figures released on 17 November. Yet an analysis of official local-authority survey estimates across the 64 Great Britain council areas where The UK Careers Fair holds events shows working-age employment rates spanning 17.9 percentage points—more than double the 8.5-point gap between the UK’s highest- and lowest-employment regions.
In ONS’s companion November regional labour market bulletin for July to September 2026, regional employment rates for people aged 16 to 64 ranged from 79.4% in the South West to 70.9% in the North East. Across the 64 Great Britain local authorities in our event footprint, rolling 12-month Annual Population Survey (APS) estimates via Nomis for July 2025 to June 2026 run from 82.5% in Guildford to 64.6% in Kingston upon Hull.
Those three official series—the national Vacancy Survey, regional Labour Force Survey estimates and local-authority APS estimates—measure different parts of the labour market over different reference periods. Taken together, they explain why neither employers nor jobseekers encounter a single “national” recruitment climate.
Small employers drove the quarterly drop in vacancies
The November Vacancies and jobs bulletin estimates 690,000 unfilled positions across the UK in August to October 2026, down 22,000 from May to July 2026 and down 31,000 (4.3%) compared with a year earlier. Quarterly vacancy numbers fell in 11 of the 18 standard industry sections, led by administrative and support service activities, construction, and transport and storage, each down by 5,000.
By employer size band, businesses with one to nine employees recorded a quarterly reduction of 22,000 vacancies—matching the net headline decline across the whole economy. The national vacancy rate stood at 2.1 vacancies per 100 employee jobs, while ONS recorded 2.4 unemployed people per vacancy in July to September 2026, edging down from 2.5 in the previous quarter.
Vacancy Survey totals are national and industry-level; ONS does not publish local-authority vacancy counts from that survey. A softer national total therefore tells a recruiter very little about candidate availability within a specific commuting catchment.
Why local council areas diverge further than regions
At regional level, ONS’s November regional bulletin (July to September 2026) records the highest unemployment rate aged 16 and over in London at 6.4% and the lowest in Northern Ireland at 2.2%, while economic inactivity aged 16 to 64 ranged from 25.8% in Northern Ireland to 17.6% in both the South East and South West. Early HMRC Pay As You Earn real-time information estimates for October 2026 pointed to falling payrolled employee numbers over the year in almost every UK region except Northern Ireland.
Zooming into individual local authorities reveals wider variation inside those regional averages. Using the latest ONS Annual Population Survey 12-month dataset on Nomis (NM_17_5, covering July 2025 to June 2026 across 64 Great Britain local authorities that host UK Careers Fair events, alongside the London region), six local authorities record estimated 16-to-64 employment rates above 80%: Guildford (82.5%), Cheshire West and Chester (81.4%), Reading (81.3%), Maidstone (80.8%), Warwick (80.6%) and York (80.4%).
At the other end of the same 64-area distribution, 12 local authorities sit below 70%, including Kingston upon Hull (64.6%), Nottingham (64.7%), Middlesbrough (64.8%), Birmingham (66.5%), Glasgow City (66.9%) and Wolverhampton (67.3%). Even within Yorkshire and the Humber alone, York (80.4%) and Kingston upon Hull (64.6%) sit 15.8 percentage points apart on point estimates.
Confidence intervals and methodological limits
Local survey estimates require more caution than national headlines. Because the Annual Population Survey samples households within each council boundary over 12 months, ONS publishes 95% confidence intervals alongside each local rate. Among the authorities cited above, those intervals range from ±3.2 percentage points in larger authorities such as Birmingham and York, and ±3.5 points in Nottingham, to ±4.4 points in Kingston upon Hull and ±5.3 points in Guildford.
Two practical rules follow from that sampling uncertainty. First, small differences of one or two percentage points between neighbouring towns are not statistically distinguishable and should not be read as a league table. Second, APS measures the employment status of residents living in an authority, not the number of workplace jobs or open adverts located there. University cities with large full-time student populations and major urban centres with younger age profiles systematically record different resident employment and inactivity rates from commuter districts.
Geography scope also differs across UK official statistics. Nomis table NM_17_5 covers Great Britain local authorities; Belfast, where The UK Careers Fair also hosts events, is covered separately under Northern Ireland’s Labour Force Survey and NISRA local labour market statistics rather than the 64-area Great Britain APS extract.
What the November figures mean for 2027 hiring
Alongside softer vacancy volumes, ONS’s 17 November Average Weekly Earnings release estimated annual regular pay growth in Great Britain at 3.5% in July to September 2026—or 0.2% in real terms after CPIH inflation—with private-sector regular pay growth easing to 3.1% against 5.4% in the public sector.
For employers planning early-2027 recruitment on The UK Careers Fair Jobs Board or in person, a falling national vacancy count does not guarantee an easy shortlist in high-employment commuter towns where four in five working-age residents are already in work. Equally, for candidates in cities where resident employment sits below 68% and small-firm hiring has tightened, widening a search across adjacent travel-to-work areas—or speaking directly with hiring managers to look past rigid job titles—matters more than national averages suggest.
Sources and method
- ONS: Vacancies and jobs in the UK, November 2026, released 17 November 2026; August to October 2026 vacancy reference period.
- ONS: Labour market in the regions of the UK, November 2026, released 17 November 2026; July to September 2026 LFS reference period and provisional October 2026 HMRC PAYE RTI estimates.
- ONS: Average weekly earnings in Great Britain, November 2026, released 17 November 2026; July to September 2026 reference period.
- ONS via Nomis: Annual Population Survey (dataset NM_17_5), July 2025 to June 2026 rolling 12-month period (last updated 20 October 2026; verified extract 18 November 2026 across 64 Great Britain event local authorities plus London region, variable 45 aged 16–64 employment rate and measure 21003 95% confidence intervals).
About this reporting: The UK Careers Fair organises recruitment events and operates the Jobs Board across the locations discussed here. All figures in this report come from public Office for National Statistics bulletins and Nomis Annual Population Survey tables under the Open Government Licence v3.0; no internal commercial records are used. Read our editorial standards and corrections policy.