
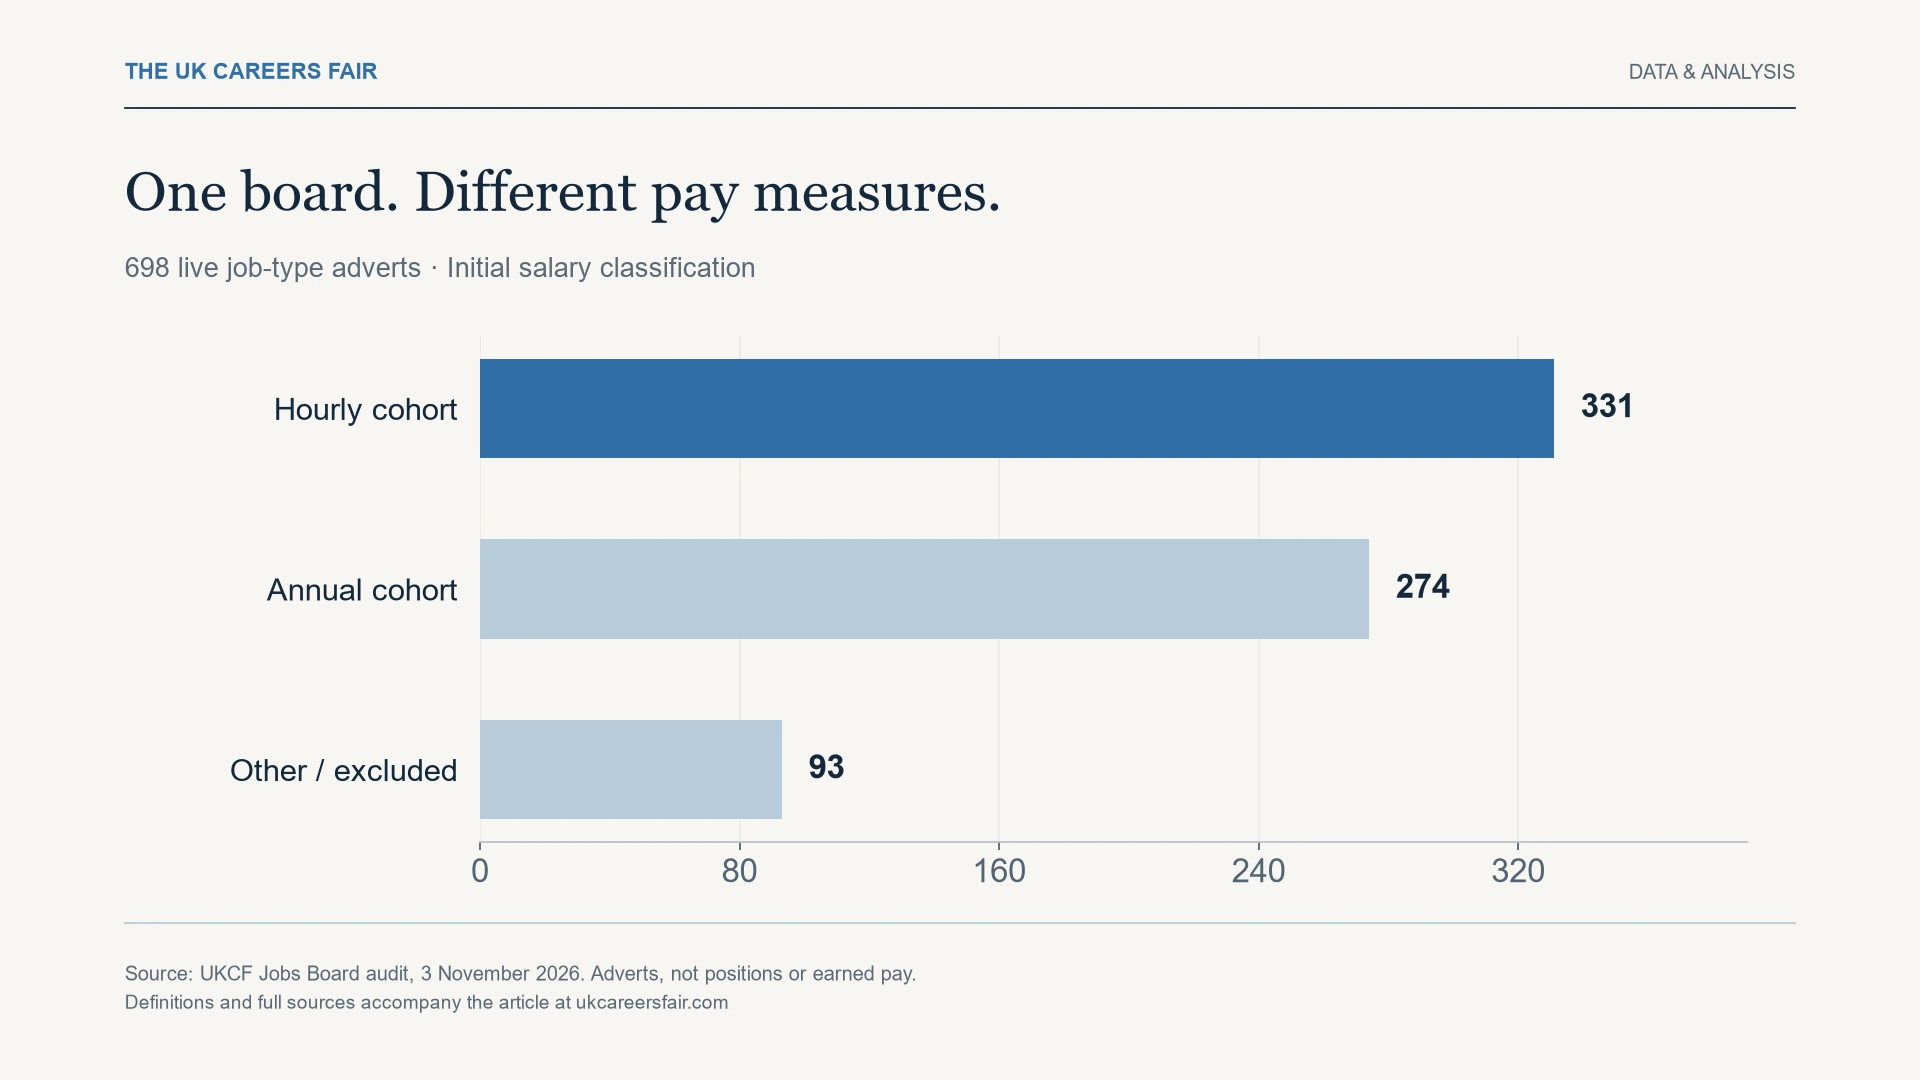
An audit of 698 live job adverts on The UK Careers Fair Jobs Board has separated 331 hourly-pay listings from 274 annual-pay listings, with 93 excluded from those initial cohorts. The finding reveals a basic obstacle to a seemingly simple question: what does the average job on the board pay?
The audit, taken at 21:38:37 UTC on 3 November, comes after official figures put annual growth in average regular earnings at 3.7%. Those earnings figures and the board’s advertised pay describe different populations, different stages of employment and different units. Combining them into a claim that our vacancies pay above or below the national average would require evidence the snapshot does not provide.
The UK Careers Fair Limited, which publishes this article, operates the board. The public methodology and salary appendix explain the scope of this original analysis and its limitations.
One board, several kinds of pay information
The 698 records were classified as jobs and were live and unexpired at the observation time. Courses, apprenticeships and other opportunity listings were kept out of this job-advert comparison. Each advert counted once, including adverts stating several openings.
The initial pay classification retained hourly and annual units separately. It excluded 21 records marked as voluntary or carrying volunteer-labelled titles, three commission records, 63 without a positive structured lower pay figure, three descending ranges and three with other units. These exclusions are mutually exclusive in the audit’s classification; they total 93.
Those are checks on recorded information, not judgements about the legality of an offer or proof that a volunteer-labelled listing is unpaid. A title, a display string and a structured pay field can communicate different things. An inconsistency needs checking against the actual arrangement.
Even the remaining cohorts are not a finished wage statistic. Annual bounds can describe different hours and employment arrangements. An employer-supplied “Full Time” label is not verified contractual-hours information or an audited full-time-equivalent salary. A quoted lower bound is not necessarily what a successful applicant earns.
What the 3.7% figure measures
ONS’s October Average Weekly Earnings bulletin, released on 20 October, estimated annual regular earnings growth of 3.7% in Great Britain for June to August 2026. Regular earnings exclude bonuses. Adjusted using CPIH inflation, growth was 0.6% in real terms.
AWE divides estimated pay by employee numbers. ONS cautions that changes in the mix of the workforce can affect the result; it is not a measure of pay rates. The figures therefore do not mean every employee received a 3.7% increase, or that every newly advertised role should rise by that amount.
The distinction is consequential for a platform comparison. Our snapshot records what selected organisations advertise at a particular time. The official series estimates earnings across a much wider employee population. More hourly roles appearing on our board could alter an unadjusted platform average without establishing any change in an individual employer’s pay policy.
The annual median has its own conditions
Another familiar benchmark comes from the Annual Survey of Hours and Earnings. ONS’s provisional 2026 results put median gross annual earnings at £40,911 for full-time employees who had been in their job for at least a year, using the April 2026 reference point. That is a defined employee-job population, not a benchmark constructed from current vacancy adverts.
An advertised range may precede negotiation, recruitment and any time actually worked. Its midpoint is a calculation performed on an advert; it is not observed earnings. Nor would removing missing pay records make the remaining advertisers representative of all employers. Missingness and selection remain part of the story.
For that reason, this analysis does not calculate a board-wide salary median or rank advertisers against the ASHE annual figure. Further checks would be needed on the quoted units, working hours, unusual values and coverage before deciding what a defensible comparison could measure.
Useful transparency starts before the average
The audit’s immediate contribution is narrower and more useful: it makes visible the information required to read the market honestly. A salary range needs a unit, a working pattern and an explanation of what the amount includes. A platform statistic needs an equally clear population and method.
Official earnings growth supplies economic context. A live advert supplies an opportunity to investigate. The quality of a decision depends on understanding the bridge between them, rather than giving two unlike numbers the same label.
Sources and method
- The UK Careers Fair: original data methodology and salary-audit appendix; Jobs Board snapshot, 3 November 2026, 21:38:37 UTC.
- ONS: Average weekly earnings in Great Britain, October 2026, released 20 October; June–August 2026 reference period.
- ONS: Employee earnings in the UK, 2026, released 22 October; provisional April 2026 results.
About this reporting: The UK Careers Fair organises the events and operates the Jobs Board discussed here. Booking figures are a snapshot at 21:35 UTC on 3 November 2026; the board-wide salary audit is at 21:38 UTC. They are not representative estimates of UK employment. Read the definitions, limitations and aggregate data. Charts are original visualisations of the cited figures.